Sometimes it is necessary to perform Image processing not on grayscale image but on colored images specially when there is a need to isolated a ROI which is characterized by its color property. Here we investigate two types of algorithms used in colored image segmentation. For the first part we discuss the algorithm for parametric probability distribution. Figure 1 shows the sample image to be used.

Figure 1: Tetris Game Image to be used for Color Segmentation
First, we need to have a basis image wherein that image would be the one which we want to detect. Figure 2 shows some sample patches.


Figure 2: Patches of Tetris blocks to be used in Color Segmentation
We further need to convert these images into rgI format wherein:
r = R/(R+G+B)
g = G/(R+G+B)
I = R+G+B


Figure 3: rgI converted Images
We then determine the mean and standard deviation of pixels values in the red and green layer and use a gaussian function to determine the probability of a pixels belonging to the patch or not.


Figure 4: p(g)p(r) plots for each of the images above.
Using this and applying the probability function for each pixel we can create a mask that when multiplied to the image will result in filtering the unwanted portions.

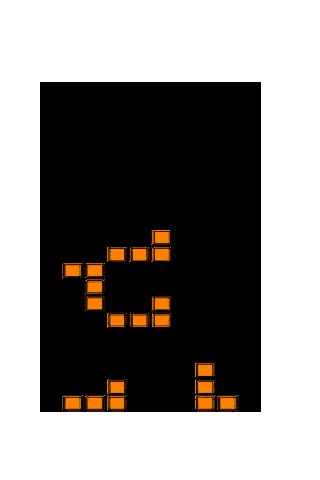


Figure 5: Segmented Images after applying mask from Parametric algorithm
Another Algorithm uses a non parametric approach wherein we take the 2D histogram of the slice and use it to map out the pixels in the image using histogram back-projection. Using these method and creating another mask to use in the image we try to detect skin on an image show in Figure 6.

Figure 6: Sample image with some SKIN!!
We take a sample slice of a skin and use it to detect other skins. First we need to convert it to rgI again. Figure 7 shows the skin and its rgI image.


Figure 7: Skin(left) rgI of skin(right)
Then we use take the histogram and backproject it to create the mask. Figure 8 shows the histogram and the masked image using 8 bins on the 2d histogram.


Figure 8: 2D histogram of skin patch(8 bins)[top left]; Mask from backprojection[top right], Masked image[bottom]
As we increase the bin size it can be seen that the masked image detects less skin since it could represent more pixels and thus being too specific on the pixels present in the skin patch Figure 9 shows these images.


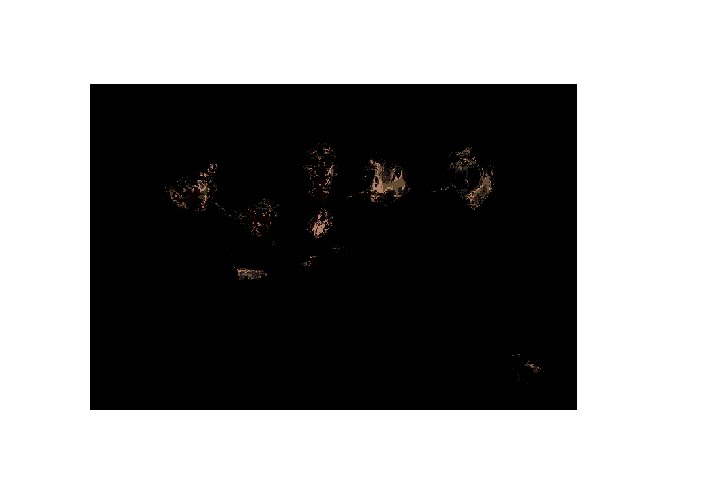

Figure 9: Masked Images from Histogram(Top to Bottom)[16, 32, 64, 128, 256] Bins.
References:
[1] M. Soriano, "Activity 13:Color Image Segmentation", AP 186, 2010
Self Evaluation: 10
No comments:
Post a Comment